Thank you! Your submission has been received!
Oops! Something went wrong while submitting the form.

.jpg)


Whether you’re just getting started or ready to take the next step, we offer no pressure, no obligation conversations with honest insight.
To make sure we use your time (and ours) well, we’ll ask a few quick questions before booking.
Your plans are a little further out, so a short introductory call is the best place to start
We'll cover your goals, how Unity investments works, and what to focus on over the coming months.

Based on your details, a consultation isn't the most useful next step just yet.
We've put together guidance to help investors build capital, understand timelines, and know exactly when speaking to us will add the most value.
Whether you want a quick overview or a deeper discussion, we’ll guide you with honest, no-pressure insight.
Choose a 15 minute intro chat or a full 45 minute consultation.
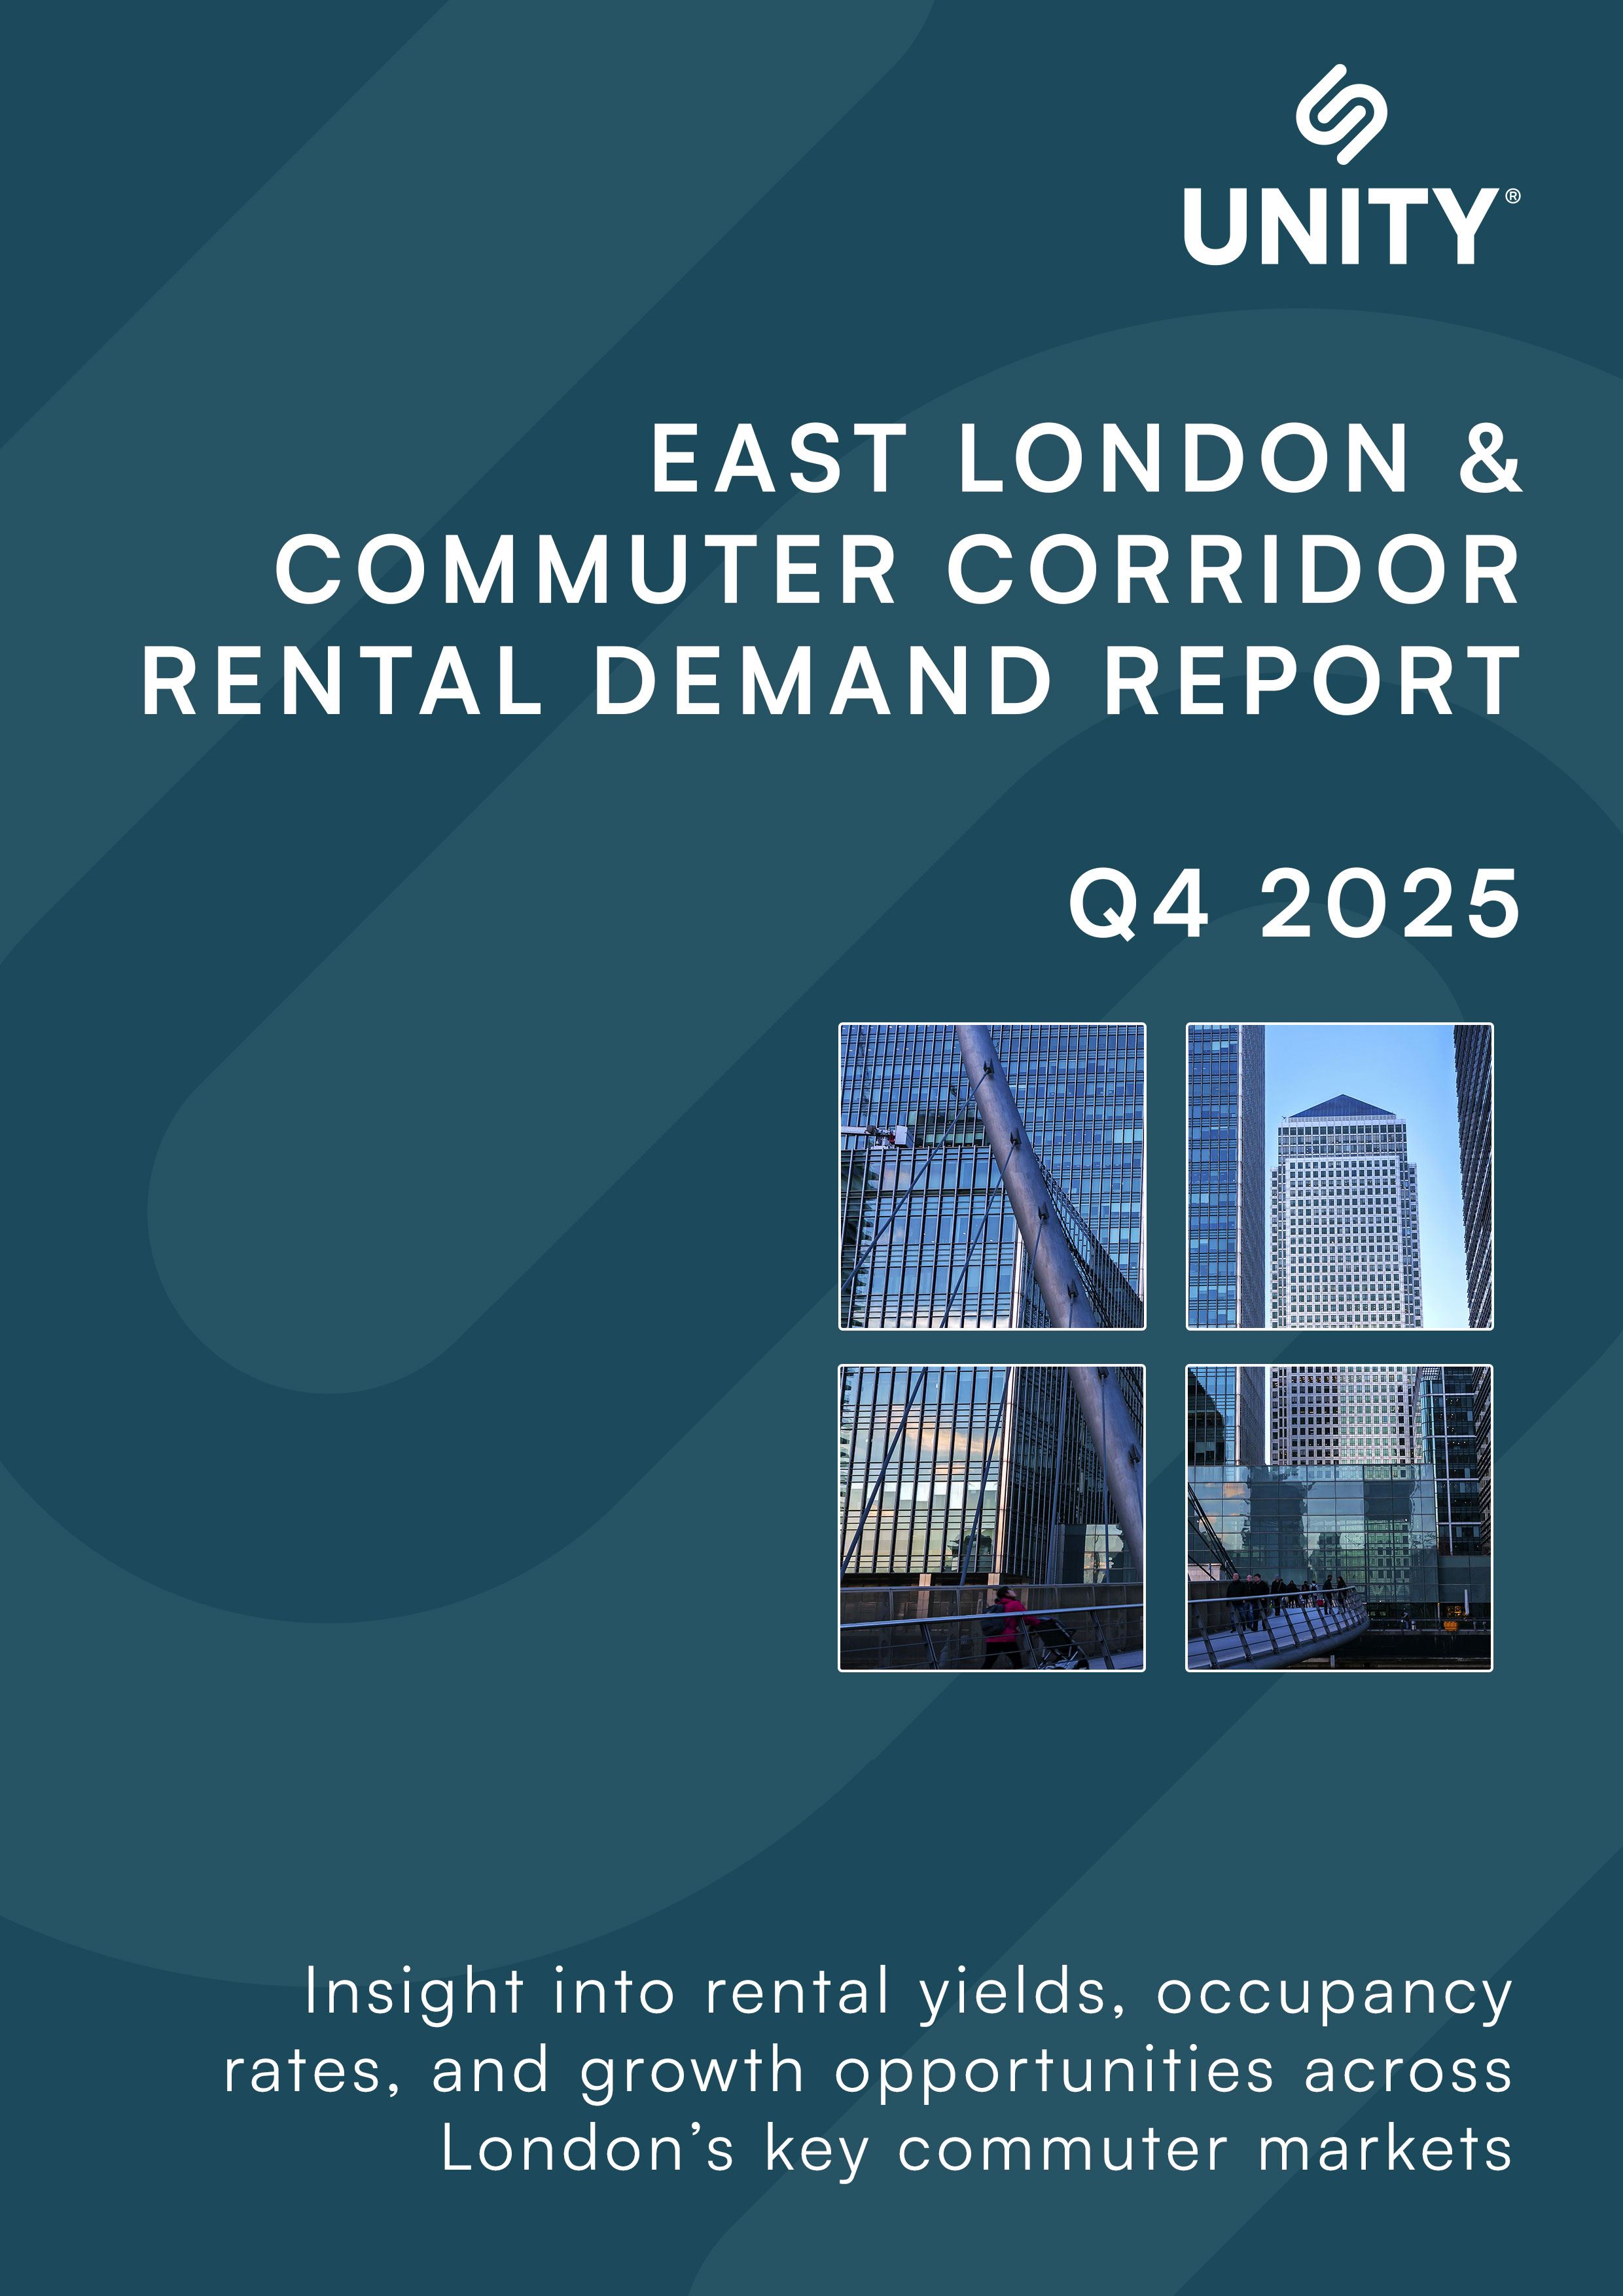
Schedule your free 15 minute call to explore East London and commuter corridor property investments, and see if they align with your goals. It’s your chance to ask questions, with no pressure and no obligation.
Schedule your free 45 minute call to explore East London and commuter corridor property investments, and see if they align with your goals. It’s your chance to ask questions, with no pressure and no obligation.
-v11.jpg)


-v1.avif)


